10 Metrics Every Software Company Should Care About
August 5, 2021
Table Of Contents
SaaS and PaaS companies have the opportunity to access and analyze their performance data with a level of granularity and accuracy that was impossible just a decade ago.
But, with the overwhelming amount of data collected by businesses daily, staying focused on things that matter the most is challenging.
In this article, you will learn everything you need to know about the critical KPIs every software company should care about to thrive: what they are, why they matter, and how to calculate them.
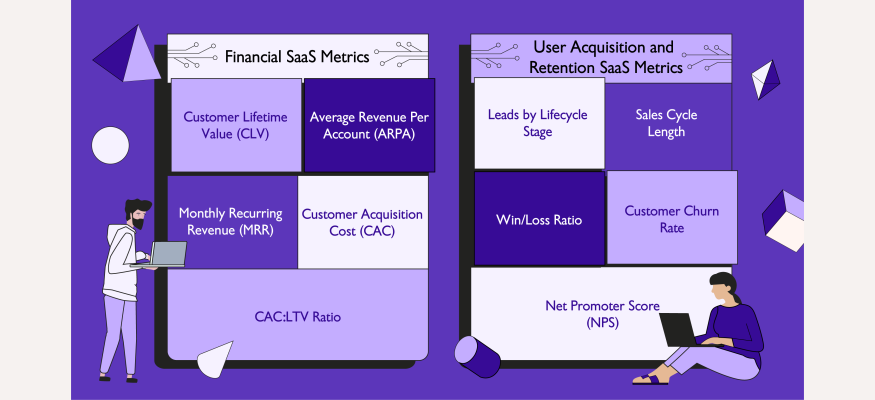
Financial SaaS Metrics
According to research done by U.S. Bank, 82% of small businesses fail due to cash flow issues. Therefore, tracking financial performance indicators is vital to ensure longevity.
Among dozens of financial KPIs, here are the top 5 to focus on:
1. Customer Lifetime Value (CLV)
Customer lifetime value (CLV or LTV) refers to the total amount of revenue a customer is expected to spend with your company over the entire period of their engagement with your brand.
Improving CLV is crucial because the metric directly impacts the bottom line, allowing you to understand how much you can spend when acquiring a new customer and staying profitable.
Existing customers are easier and less expensive to target. According to a recent study, existing customers spend 67% more on average than those who have never bought from your company. In fact, in their book “Marketing Metrics” Neil T. Bendle, Paul W. Farris, and Phillip Pfeifer estimated that 60 - 70% of conversions are likely to come from an existing client.
In contrast, the average new customer conversion rate is only 5 to 20%.
The formula:
CLV = (Customer Value * Average Customer Lifespan)
The formula can be broken down into the following building blocks:
Customer Value
: find this value by multiplying the average purchase value (APV) by the average order frequency (AOF):
Average Purchase Value
: the amount of revenue generated by your customers divided by the total number of purchases.
Average Order Frequency:
the total number of purchases divided by the overall number of customers.
Average Customer Lifespan (ACL): the average number of years your users keep being your paying customers.
For instance, if your typical customer spends $3,000 per month on the services provided by your SaaS company, and on average, stays with your company for two years before canceling their subscription, your CLV would be:
Customer Lifetime Value = $3,000 (APV) x 12 (AOF) x 2 (ACL) = $72,000
2. Average Revenue Per Account (ARPA)
The average revenue per account, or ARPA, is a metric that indicates the average amount of revenue each customer generates for a company over a given time.
Knowing your ARPA helps adjust the pricing model to ensure profitability and analyze the factors contributing the most to the overall revenue.
ARPA is all about dissecting your accounts under a financial microscope to identify the services and segments of users that make the most significant impact.
Are your premium users that put more pressure on your support team bringing enough value to justify that? What service packages are generating the most revenue per user? Have you picked the right user segments to target?These are just a few of the questions that ARPA can help you answer.
The formula:
Average Revenue Per Account= Monthly Recurring Revenue / Total # of Customers
While the second part of the equation is pretty self-explanatory, we’ll cover how to calculate your monthly recurring revenue (MRR) in the next section.
As an example, imagine that 5,500 of your premium users generate $150,000 MRR while 15,000 of the customers subscribed to the standard plan bring in $350,000. Therefore, the ARPA for these two segments would be the following:
ARPA (Premium plan) = $150,000 / 5,500 = $27.26
ARPA (Standard plan) = $500,000 / 15,000 = $23.33
If the additional customer service costs related to serving the premium users are not worth the additional $3.93 each premium account generates, it might make sense to stop subscribing new users to this plan.
3. Monthly Recurring Revenue (MRR)
Monthly recurring revenue, or MRR, is the amount of predictable, “guaranteed” revenue that a company expects to earn every month from its customers.
All new companies breaking into the SaaS industry and 80% of the historical vendors opt for the subscription-based business model according to a 2018 report from Gartner.
That brings many unique benefits to SaaS companies, but one beats them all: controlling your MRR is the key to predictable growth.
Knowing your MRR makes it possible for you to make more accurate revenue projections and budgets in a more predictable way, allowing you to take more risks.
The formula:
Monthly Recurring Revenue = Total Number of Paying Customers x Average Revenue per Account (ARPA)
If you want to take a more granular look at your MRR, this is where net monthly recurring revenue comes into play, a metric that breaks down the positive and negative changes in your MRR, as well as the factors contributing to it:
Net Monthly Recurring Revenue = Existing MRR + New MRR + Expansion MRR - Contraction MRR - Churned MRR
Existing MRR: the MRR you have at the end of the previous month
New MRR: the MRR generated from getting new customers.
Expansion MRR: the MRR generated from upgrading the existing customers to a more expensive subscription plan.
Contraction MRR: the MRR lost from downgrading the existing customers to a cheaper subscription plan.
Churned MRR: the MRR lost due to customer cancellations.
If you have 13,000 users that signed up to your annual subscription plan and the average monthly subscription fee equals $50,, you can quickly come up with your MRR:
MRR = 13,000 (Total Number of Paying Customers) x $50 (ARPA) = $650,000
4. Customer Acquisition Cost (CAC)
Customer Acquisition Cost, or CAC, is a crucial business metric that shows the average cost of the sales and marketing efforts it takes to attract a new paying customer.
Read More: What Is Customer Acquisition Cost (CAC)?
Your CAC is an excellent barometer for the health of your sales and marketing pipeline. If the amount of money a company spends on attracting new customers exceeds the revenue generated by these users, the days of that company are inevitably numbered.
Additionally, CAC helps identify and prioritize the best-performing sales and marketing channels, tactics, and campaigns to streamline the expenses on customer acquisition.
The formula:
Customer Acquisition Cost = (Total Marketing Expenses + Total Sales Expenses) / The Number of New Customers Acquired
The sum of marketing and sales expenses entails all of the labor, overhead, and advertising expenses factored in, including sales commissions.
As an example, imagine you spent $350,000 in total on marketing and $150,000 on sales to attract 5,000 paying customers. This combination would result in a CAC of $100.
Customer Acquisition Cost = ($350,000 + $150,000) / 5,000 = $100
In and of itself, the number can’t draw an accurate picture. But, if you knew that your CLV was $90, that would be a cause for major concern. This brings us to the next metric.
5. CAC:LTV Ratio
A LTV:CAC ratio measures the relationship between the cost of attracting customers and the lifetime revenue they generate for a company.
Even though both CLV and CAC are crucial business metrics on their own, the LTV:CAC ratio speaks volumes about the financial well-being of your company.
If the ratio is too low, that means that a company is actively diminishing the net profit with each new customer acquisition, while a high LTV:CAC ratio means that the organization is not spending on customer acquisition as much as it should to maximize its marketing and sales efforts.
A 3:1 LTV:CAC ratio is considered to be ideal - but that can vary based on the niche you’re in
A 1:1 (or less) LTV:CAC ratio means that a company is losing money with each new customer
A 5:1 (or more) LTV:CAC ratio is a sign that a company needs to double-down on their customer acquisition spend
The formula:
CAC:LTV Ratio = Customer Acquisition Cost / Customer Lifetime Value
User Acquisition and Retention SaaS Metrics
Active users are the lifeblood of any SaaS company, so every single one of them is worth their weight in gold.
With the help of the metrics outlined below, you’ll be able to closely monitor how good you are at attracting new customers and retaining the existing ones.
6. Leads by Lifecycle Stage
This set of metrics measures the conversion rates across the entire funnel - how many users that entered the funnel made it through each of its stages?
Read More: The Complete Guide to B2B Lead Scoring
Segmenting by lifecycle stage is a great way to identify weak spots in your sales and marketing pipeline.
Conventionally, each user has to go through multiple stages before converting into a paying customer:
Visitors to Marketing-Qualified Lead (MQL): the number of passersby that showed interest in your product or service
MQL’s to Sales-Qualified Lead (SQL): the share of MQL’s that are ready to talk to a sales representative
SQL’s to Customers: the number of SQL’s your sales team managed to convert into paying customers
For example, if you managed to convert 1,000,000 visitors into 2,000 SQL’s, but your sales team converted only 30 of them into paying customers and you know that the conversion rate in your industry is 20 percent on average. Then, you may need to inspect the way your sales representatives handle leads.
Read More: How To Qualify a Lead
7. Sales Cycle Length
Sales cycle length measures the average amount of time it takes to close a deal, from the initial contact with the brand, to where the opportunity is either won or lost.
It’s essential to accurately measure the metric because the shorter the cycle, the faster the business generates revenue.
Additionally, the Sales Cycle Length helps SaaS companies build realistic quotas and forecasts for the sales team and put together more accurate growth projections.
The formula:
Sales Cycle Length = Total Number of Days to Close Deals / Number of Closed Deals
According to HubSpot, the average sales cycle length in SaaS is 84 days, but understanding the benchmark in your specific niche helps you gauge the performance of your salespeople.
8. Win/Loss Ratio
A Win/loss ratio measures the percentage of opportunities your sales team managed to convert into paying customers.
This ratio facilitates tracking progress towards achieving the stated sales goals. If your win/loss ratio is low, that may mean that there might be gaps in your product, your USP, or your sales process.
The way you calculate your win/loss ratio is pretty straightforward:
Win/Loss Ratio = Total of Number of Won Opportunities / Total of Number of Lost Opportunities
According to the RAIN group, salespeople close 47 percent of opportunities on average. If you notice an unusually high or low win/loss ratio related to a specific user segment, product, or service, those deviations from the norm need to be investigated.
9. Customer Churn Rate
Customer churn measures the percentage of your user base that canceled their subscription to your services over a certain time.
Customer retention is the holy grail of all SaaS companies for one reason: A recent Ipsos study found that keeping your active users’ buying costs as much as five times less than acquiring new customers.
A high attrition rate typically means two things: your users are being either lured away by a better alternative or forced to leave due to something in your product or processes.
Getting to the bottom of what’s causing your churn rate to go up may help you identify areas of improvement in how you serve your customers.
To calculate your churn rate, divide the number of users that stopped using your services by the overall number of paying customers:
Customer Churn Rate = Total Number of Churned Customers / Total Number of Customers
10. Net Promoter Score (NPS)
Net promoter score (NPS) is a customer satisfaction metric indicating how likely your customers are to recommend your company.
Per Adweek, 74% of people report that word-of-mouth is a crucial component influencing their purchasing decisions.
According to a recent Nielsen study, 92% of consumers believe recommendations from their close circle over all forms of advertising. SaaS companies therefore go the extra mile to ensure high customer satisfaction.
The methodology of gauging NPS is easy to follow as it’s based on a straightforward question your customers need to answer:
On a scale of 0-10, how likely is it that you would recommend [company name] to your friends, family, or business associates?
The answers are divided into the following categories:
Detractors (6 or less): unhappy customers who are likely to engage in negative word-of-mouth
Passives (7 to 8): satisfied customers who get their needs fulfilled but are not happy enough to promote your product
Promoters (9 or more): brand loyalists who are happy to actively promote your product or service
Having segmented the results into these three categories mentioned above, calculate your NPS using the following formula:
Net Promoter Score = Percentage of Promoters - Percentage of Detractors
Meet Your Reliable Data Partner
In the highly competitive world of SaaS, you are only as good as your data.
And, while the metrics covered in this article will help you keep track of your company’s performance, the solutions provided by People Data Labs are designed to help you scale your sales and marketing efforts using the power of high-quality data.
From lead enrichment to audience generation, our database containing more than 2.5 billion profiles is the secret sauce some of the world’s largest companies use to grow their businesses.
Reach out to our team today and schedule a free consultation.
Like what you read? Scroll down and subscribe to our newsletter to receive monthly updates with our latest content.