Announcing the Flex Index by Scoop
February 9, 2023
Table Of Contents
There’s no denying that since 2020, workforce behavior has become highly unpredictable. To address the unpredictability, companies have adopted a more flexible approach to how their employees work. According to The Flex Index, a new robust source of company in-office requirements, created with our partner, Scoop, 51% of US Firms now offer work location flexibility.
We encourage you to interact with The Flex Index, or access the inaugural Flex Report which we summarize below.
A Data Partnership to Uncover Insights on Workplace Dynamics
Scoop was founded in 2015 to address the rising challenge of managing a flexible workforce. They recognized a challenge in decision making for companies trying to determine the best approach for their employees, and set out to address some pressing questions:
How can a company quickly decide if they should implement full time in-office, a structured hybrid setup, or full flexibility?
Which days are best for employees to come into the office?
How can a flexible workspace be managed in one central system?
Scoop makes this entire process easier and more efficient by enabling employees to share their work location, set routines, integrate personal calendars, gather company-wide feedback, and more. Scoop enables HR and workplace leaders to glean insights on work location trends and office usage with added context on how industries and locations approach workforce flexibility.
While demand for flexible work is at an all-time high, there remains a massive insight gap on how flexibility has come to life across industries, geos, functions, and more. The Flex Index (and Q1 Flex Report) closes that gap by providing the most comprehensive details on flexible work offerings and trends.
In order to enhance the data in The Flex Index, Scoop reached out to People Data Labs (PDL) for our company insights data. With this data, Scoop was able to get an accurate and comprehensive view of workplace flexibility segmented by company using our top_us_employee_metros field. Scoop then further aggregated this data by industry, location, and company size to create an extensive, digestible outline of workplace flexibility.
With these two datasets combined, Scoop was able to generate actionable insight around remote work across segments like geography, company size, and industry.
The Status of our Rapidly Changing, Highly Flexible Workforce
Scoop compiled data on over 4,000 companies employing more than 100 million people, forming a reliable picture of workplace flexibility, particularly in the US.
As stated above, 51% of US firms now offer work location flexibility. However, companies rarely share the same definition of “remote work”.
Flexibility Types
So, before we dive in, let’s outline some remote work definitions:
Fully flexible: companies that are fully remote (have no physical office space) or give their employees a choice whether or not to come into an office.
Structured hybrid: companies that set specific expectations on when employees work from an office. This can be a requirement of a minimum number of days per time period, specifically outlined days (such as every Tuesday), or a minimum percentage of time (such as 20%).
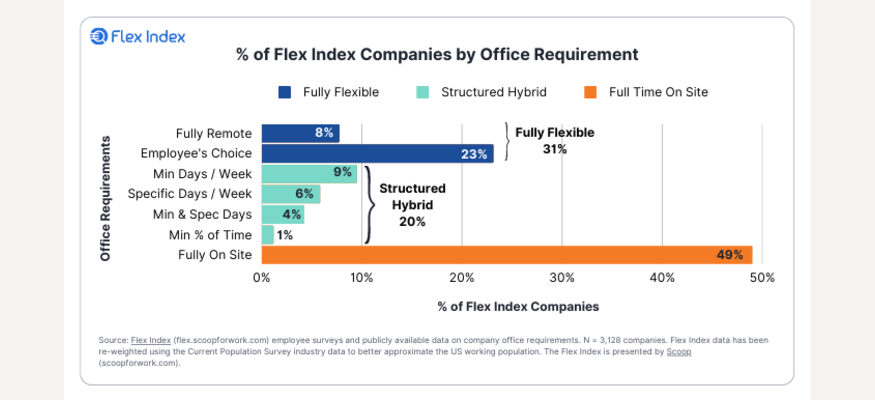
As you can see, companies that are not fully on site all have different approaches to remote work. Note that despite the shift to remote work, only 8% of companies are fully remote. Job seekers searching for fully remote opportunities still have somewhat limited options.
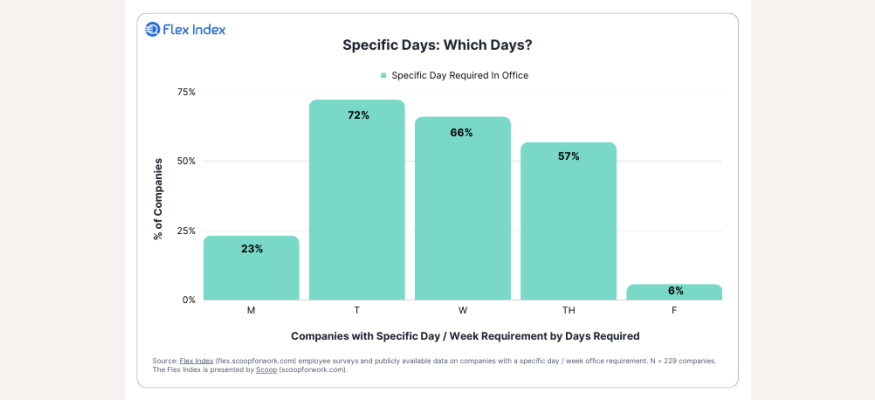
Flexibility by Day
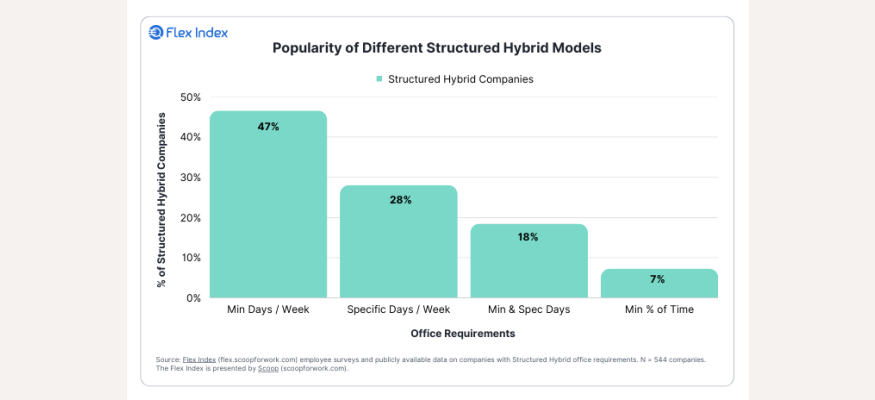
For structured hybrid work models, the most common approach is a minimum day per week requirement (47%), with specific days as a clear second approach (28%).
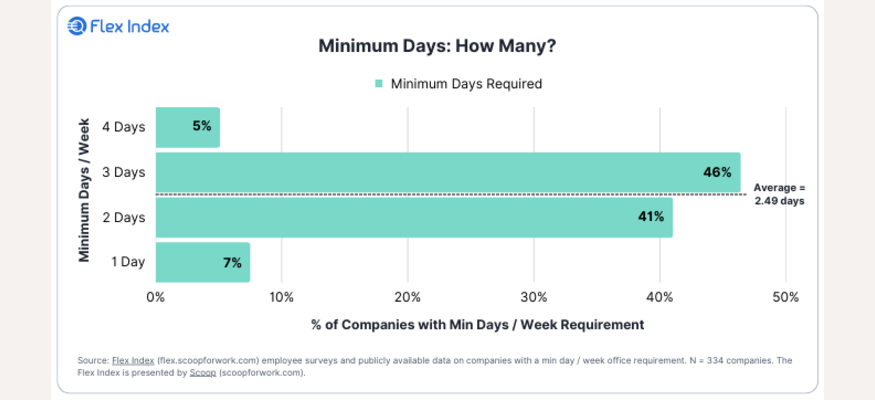
And, for the minimum day per week structure, the average company requires workers to spend about 50% of the time in the office.
The middle of the week is the most common required in-office work schedule, and the most common required work day is Tuesday.
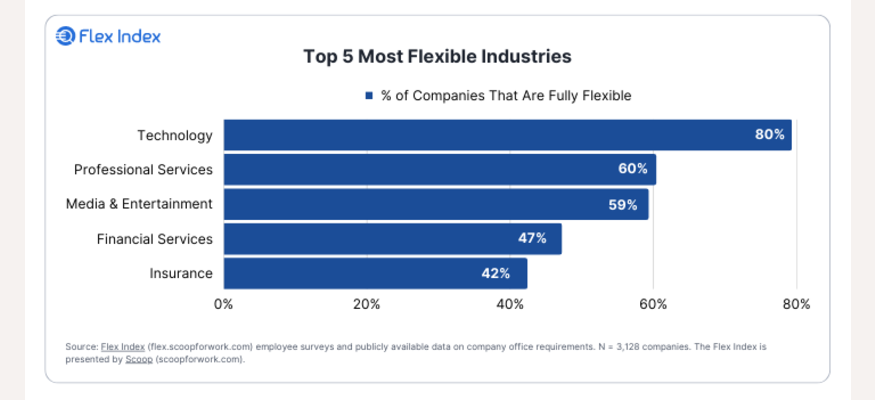
Flexibility by Industry
Nearly 80% of Technology companies identify as Fully Flexible, the highest of any industry surveyed. Professional Services, Media & Entertainment, Financial Services, and Insurance round out the top five.
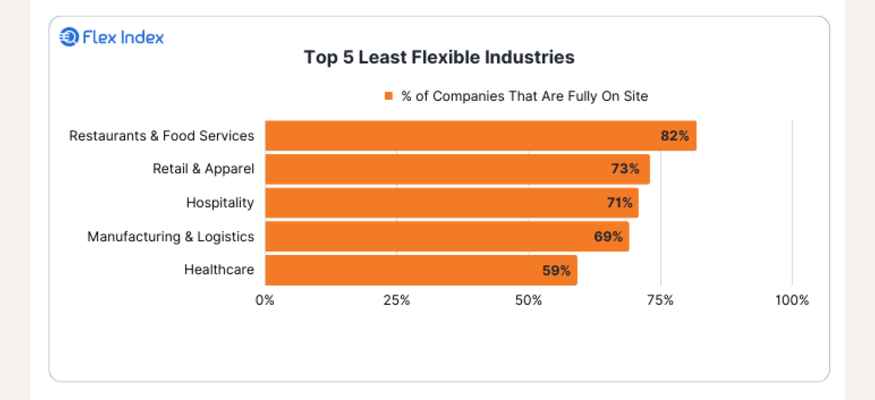
Conversely, but maybe not surprisingly, the industries requiring the most on site work are also the industries that depend the most on foot traffic to be successful.
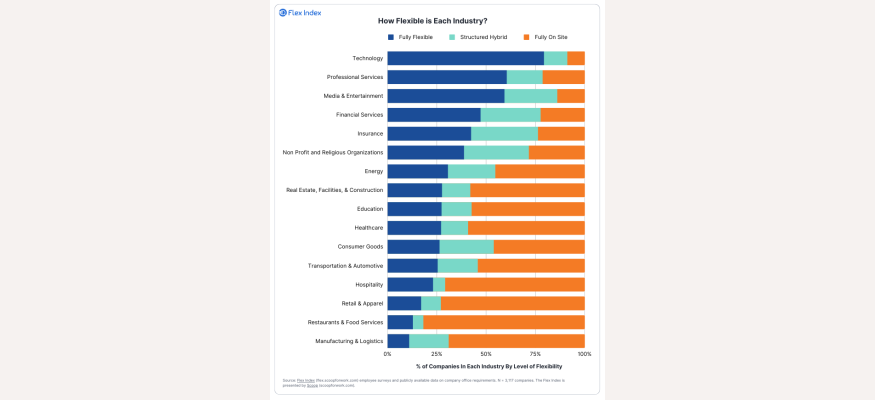
The Flex Report also provides a birds-eye view of flexibility by industry.
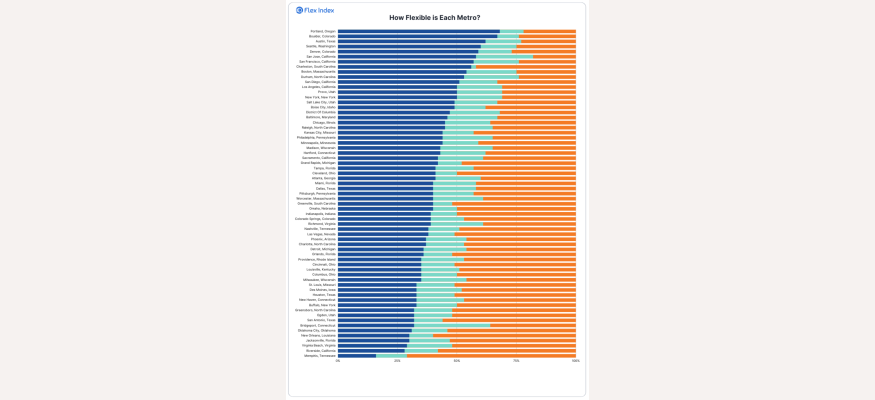
Flexibility by State & Metro
PDL’s data was specifically leveraged by The Flex Index when analyzing workplace flexibility at the state and city level.
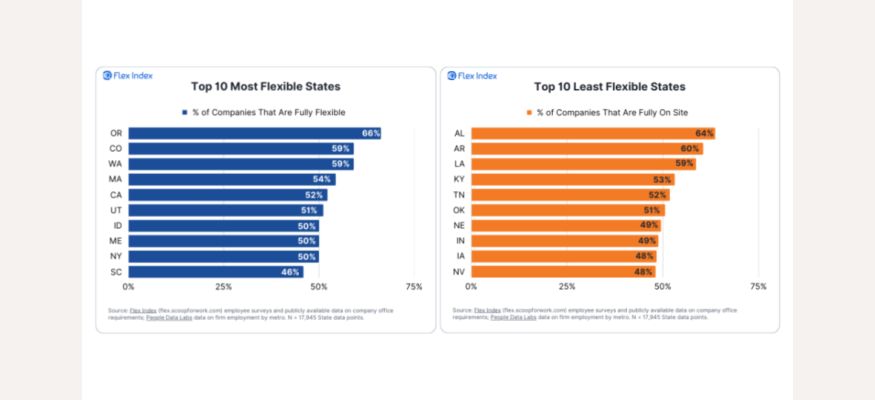
Given that the top industry for flexibility is technology, you may have assumed the top state for full workplace flexibility would be California, but that is not the case! Oregon, Colorado, Washington, and Massachusetts are actually more fully flexible than California, putting California in 5th place.
Companies in the South and Midwest more frequently require full-time office work. But, there are some unique cases, like South Carolina, which made the top 10 list with 46% of SC companies offering full flexibility.
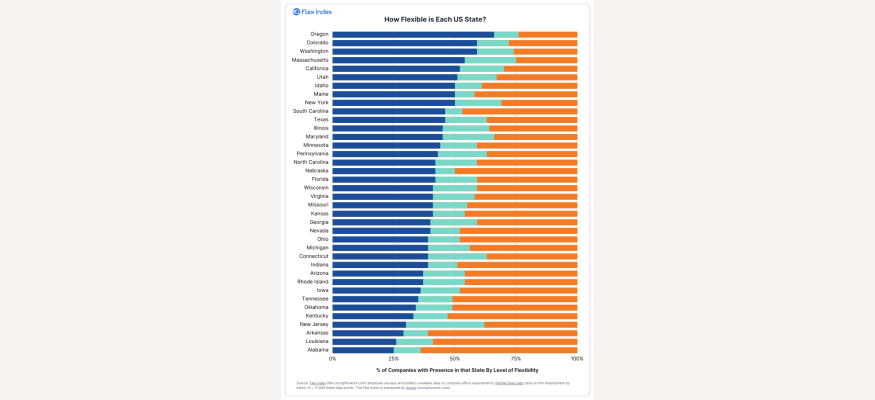
The Flex Report zooms out here as well to see the full picture of the continental United States.
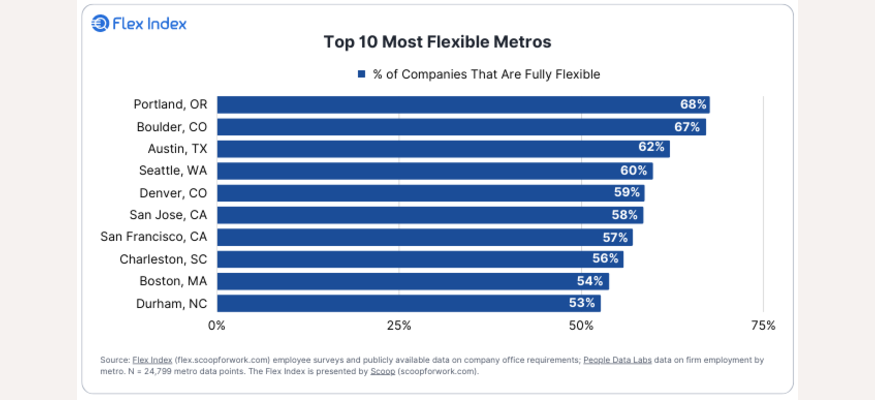
With PDL data, The Flex Index can get even more granular by displaying each city’s flexibility. Perhaps the most interesting finding here is that emerging hubs in Austin, Charleston, and Durham made the top 10 list of most flexible cities.
Notice how South Carolina and North Carolina have cities on both lists. This is a great area for further investigation as to why these states are so polarized in workplace flexibility.
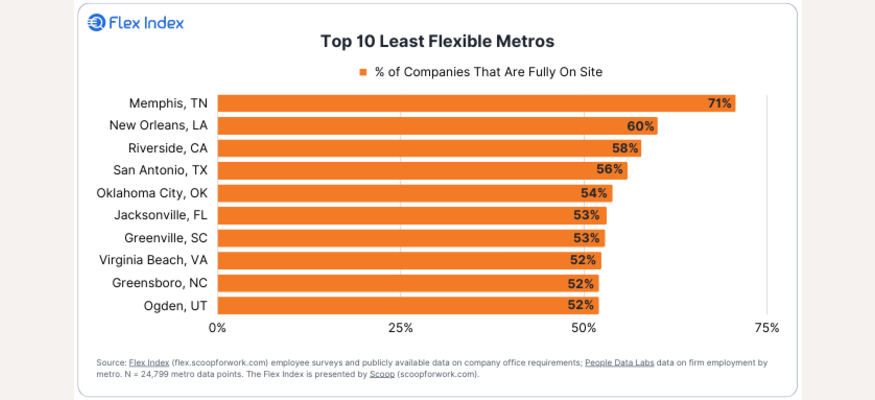
Notice how Memphis is a very strong outlier for on-site work with 71% of companies requiring fully on-site work. This highlights a good opportunity to explore the underlying data to understand why this is the case.
You can see the full list of metros analyzed by the Flex Index report here as well.
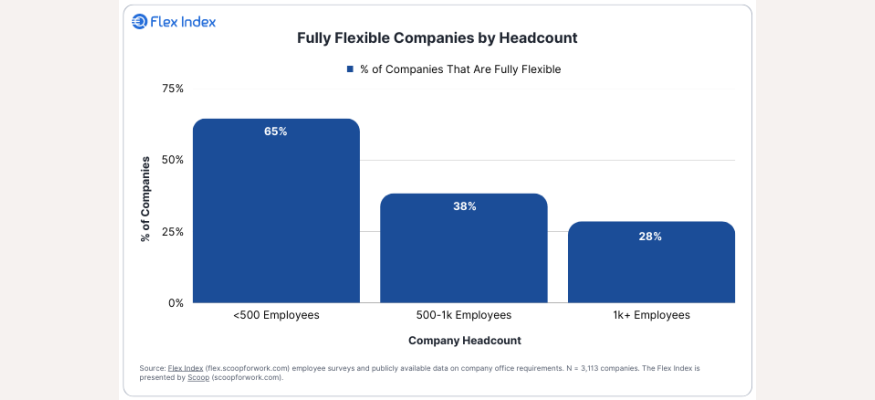
Flexibility by Company Size
Last but not least, additional insight was found by analyzing flexibility by company size.
Flexible work is more likely to be found at smaller companies, as companies under 500 employees are more than twice as likely to be fully flexible than companies with more than 1,000 employees.
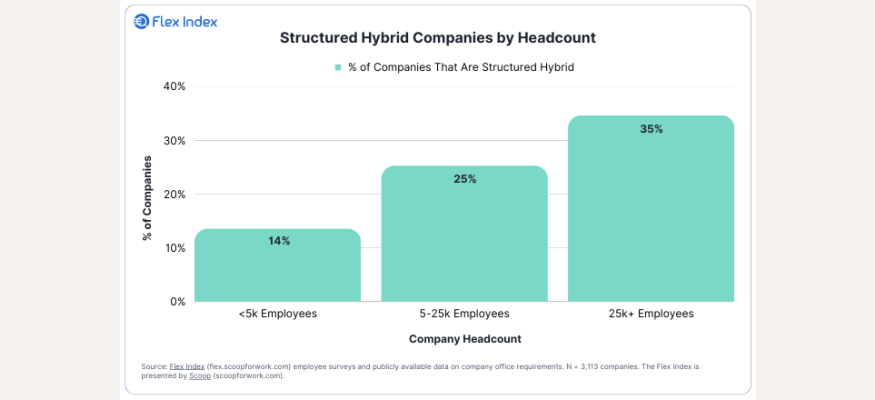
The larger the company, the more likely they utilize the structured hybrid approach. In fact, companies with 25,000+ employees are 2.5x more likely to be in a structured hybrid program than companies with less than 5,000 employees.
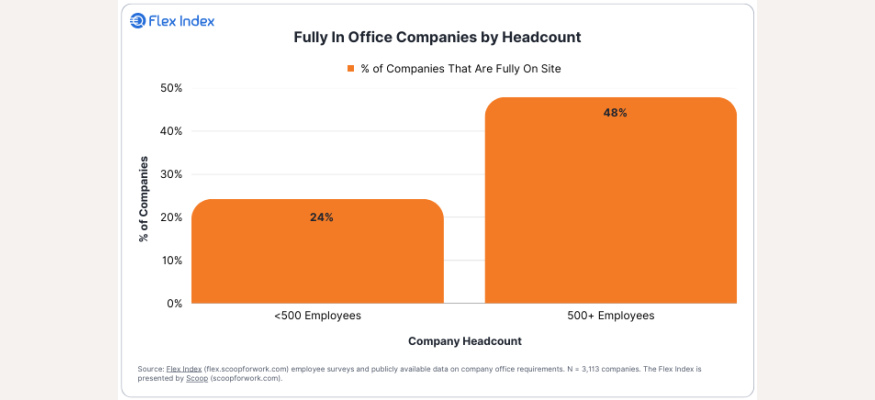
Also, companies with 500+ employees are 2x more likely to require full on-site work than companies with less than 500 employees.
A World of Possibilities
No doubt, world and workplace norms have changed drastically over the last three years. Change can be daunting, but where there's a high rate of change, data can reveal opportunities.
The findings summarized here are only the tip of the iceberg of possibilities with our data. For instance, let’s imagine these trends were also outlined over time. With that past and present data, you can form predictions about where industries will be in a certain amount of years to inform your strategy.
People Data Labs continues to work with innovators using B2B data to drive successful business outcomes. Applications of insights from The Flex Report and PDL data can be used in Corporate Real Estate, HR, Retail, and more as B2B and B2C businesses adapt their planning and operations to a changing labor landscape.
People Data Labs’ Company Insights Data
PDL built aggregated employment statistics at the company level, which we call “Company Insights”, where we track changes in headcount over time, executive change, and distribution of employees by country and by metro. Scoop was able to combine this data with additional surveys and reports to create The Flex Index, the largest single source for company in-office requirements (over 4,000 companies).
On top of understanding workforce behavior, you can do a lot more with this data, including:
Identifying Company Growth Early by tracking employee growth, monitoring headcount flows, flagging important hires, creating time-series geographic employee breakdowns, etc.
Tracking Company Health by implementing alerts based on key departures or monitoring churn rates
Building revenue models and calculating addressable markets based on headcounts by job role or industry
Monitoring risk by utilizing information around churn and average executive tenure to understand if a market or company is worth a potential deal/partnership or investment.
We encourage you to test drive our data with a free trial if you have not already, and to reach out to us for access to our premium Company Insights fields.
We expect to see many more great insights from Scoop and The Flex Index as they continue to evolve.
If you want to see more examples of our data in action, check out our various resources including case studies, webinars, and more.